Marine & Coastal
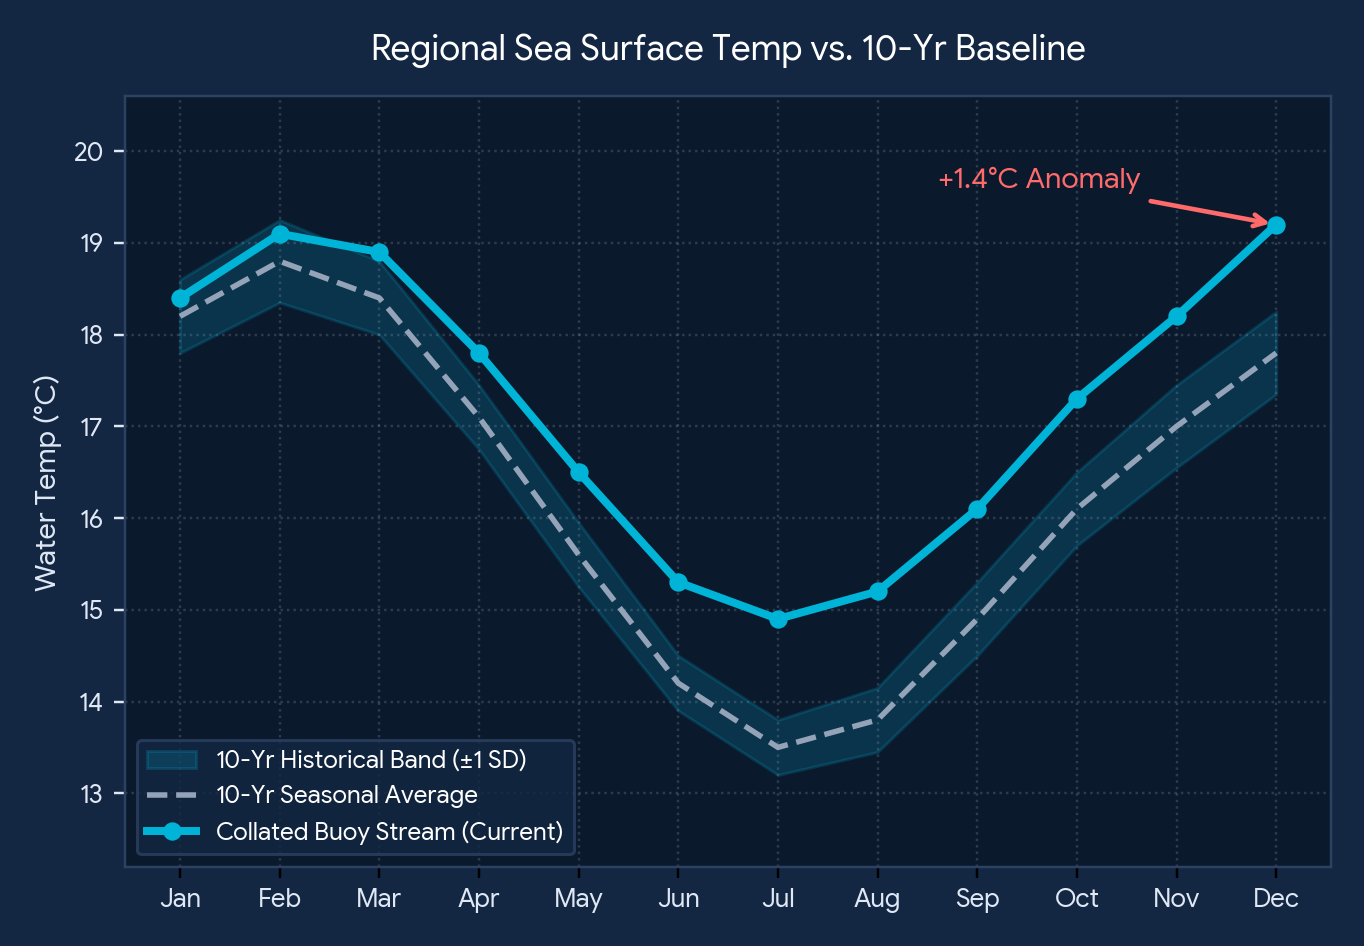
Connects autonomous buoys, subsea loggers, and coastal stations to track sea surface temperature, salinity, dissolved oxygen, and pH—separating temporary weather spikes from long-term thermal shifts (+1.4°C anomaly detection).
Coming Soon • Unified Environmental Intelligence
Organizations collect millions of environmental readings every day, yet most stay trapped in isolated networks. sensorsanywhere.com is an upcoming cloud platform that collates dispersed marine buoys, commercial building monitors, and outdoor microclimate stations—automatically aligning live telemetry against multi-year historical baselines with zero hardware rip-and-replace.
Hardware-agnostic ingestion designed to work alongside your existing field sensor investments.
Dispersed wireless sensors capture temperature, humidity, water quality, air pressure, and CO₂ across LoRaWAN, cellular, satellite, and open APIs.
Encrypted gateways normalize diverse sampling rates, legacy archives, and vendor formats into one unified chronological timeline.
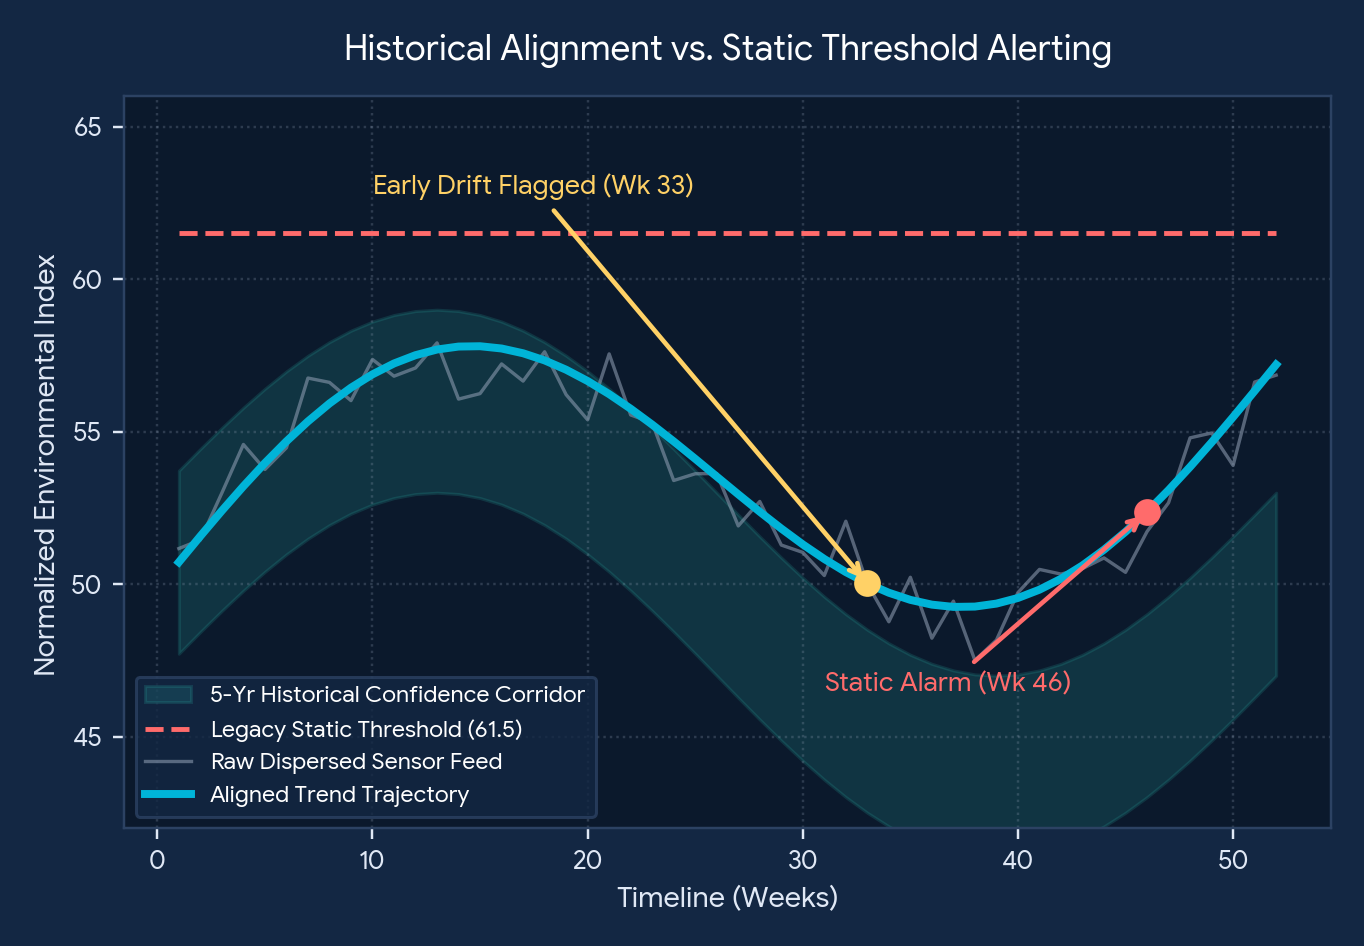
Analytics engines overlay live trends onto historical baselines to flag gradual drift early and generate audit-ready compliance reports.
Built for coastal & marine operators, commercial real estate portfolios, and environmental research teams.
Connects autonomous buoys, subsea loggers, and coastal stations to track sea surface temperature, salinity, dissolved oxygen, and pH—separating temporary weather spikes from long-term thermal shifts (+1.4°C anomaly detection).
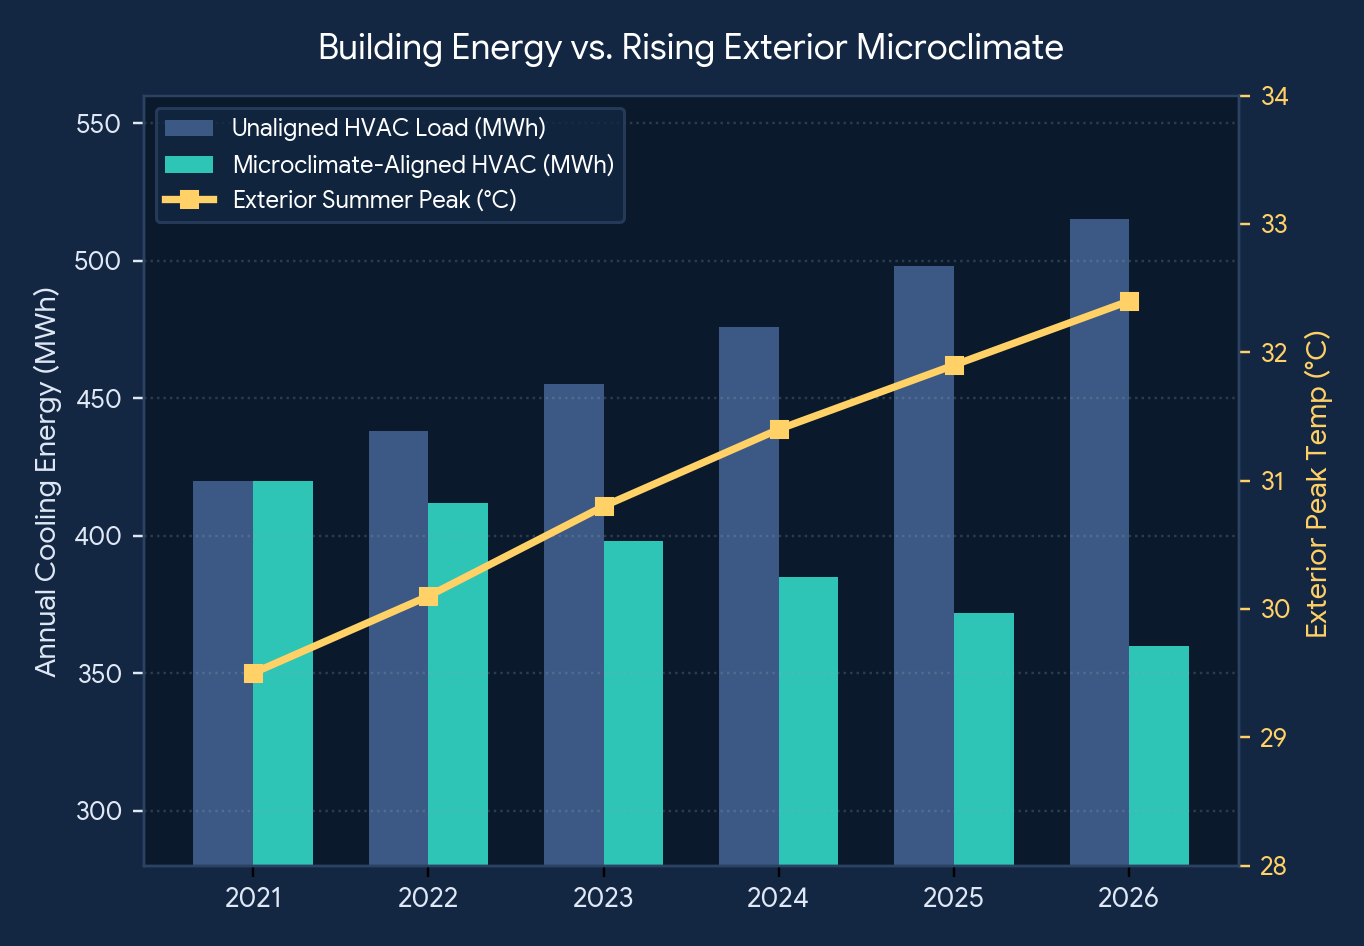
Links indoor room sensors with exterior facades, rooftops, and grounds to correlate external heat peaks with internal HVAC load and indoor air quality—generating audit-ready energy and workplace safety trails.
“Today’s Anomaly Is Tomorrow’s Baseline.” Aligns legacy archives with high-frequency streams so decision-makers catch gradual shifts 13 weeks ahead of noisy static threshold alarms.
sensorsanywhere.com is currently preparing for upcoming release and pilot deployments. Reach out directly or submit an inquiry below for the technical architecture briefing, pilot availability, or integration specifications.